
 Because it was the week before Christmas and because of the craziness of Covid, you might have missed the biggest release of 2020. I introduced it as our Digital Assistant - Scheduled Reports. That was just over two months ago. There wasn't a lot of fanfare, we just offered it quietly as a gift.
Since then, our team along with many of our top users have begun experimenting with scheduled reports. We knew it was a powerful feature and that we would need to experiment and publish possibilities with a solid blog series on reports.
That series begins now. With perhaps the most common of all reports - Giving.
In Churchteams there are 10 types of giving reports. Each of these has a subset of output options to choose from. And that's before you choose the people on whom you want to see the report which can be selected from any combination of group, member or contribution data in the software. And that's a lot.
But, here are a couple of the basic ones to get us started.
Weekly Summary Report
On a weekly basis, most pastors and finance teams want to see a summary report on giving the past week. This is the Contribution summary report (Reports > Financial > Contribution Summary).
When you select it, you'll be prompted to pick the date range (last Monday through last Sunday to accomodate online giving). That's generally enough. Then Run the report to see:
- Totals by designation.
- Totals by contribution method.
- Totals by church member type.
- Totals by recurring / non-recurring.
- Grand totals.
- Stats - High, Low, Average.
Once you've created the report, you can Save it before or after running it. When you do, you'll be prompted to give it a Report Name, Security level (to determine who can see it), and a Date range. Use the drop down to set the date range to "Last X weeks (ending Sunday)" and put in a 1. Then Save.
Contribution Summary Chart
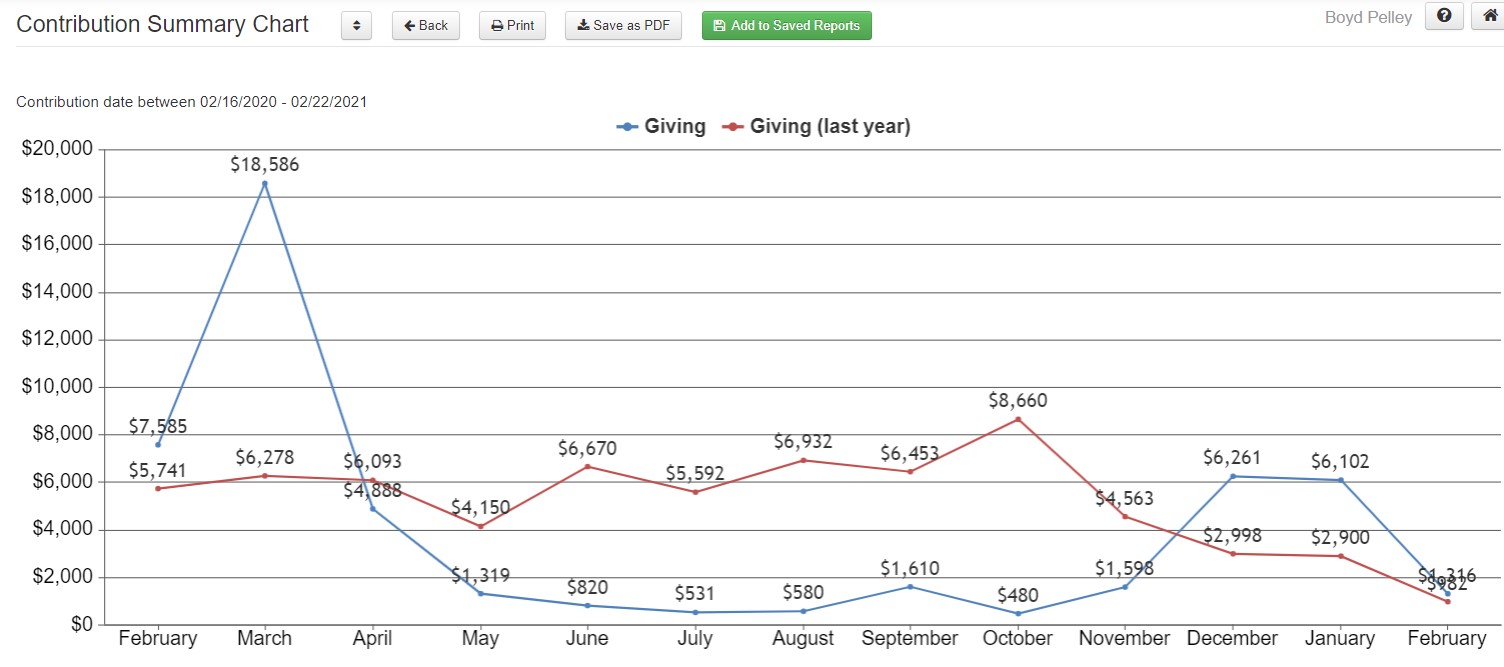
Weekly giving is helpful but zooming out to see it in a broader context is just as important. This is the purpose of the Contribution Summary Chart (Reports > Financial > Contribution summary chart).
When you select this report, choose the option to make it a Line chart, Display giving: Monthly, Compare to prior year, and a date range (often a full year). You'll see a lot of other options if you want them, plus any filters. If this is your first time, don't worry about any of these. When you run the report, you'll see a really nice line chart like this:
Now, click the "Add to saved Reports" button. Give the report a name, security level, and date range (Last X weeks, 53). Save.
Saved Reports
Now that both of these reports are saved, you'll be able to view them in 3 places:
- Saved Reports. Reports > Groups, click the dropdown above Groups.
- Me Card on the Home page. Click the gear icon to add either report.
- Metric Card on the Home page. Click gear icon to add the line chart.
Schedule the Reports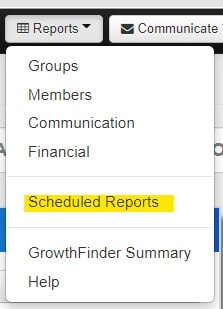
Most reports, once saved, are available to be scheduled. (Reports > Scheduled reports).
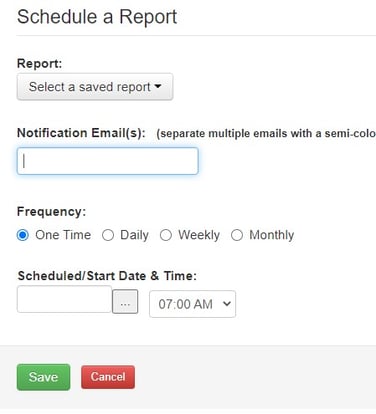
Click the blue button: + Schedule a report.
- Select the report from the dropdown.
- Put in the email addresses of everyone you want to receive the report (separated by ;).
- Select your desired frequency.
- Select the start date and exact time.
Note: Be sure to schedule the report to come out after check and contributions are entered for the week to make sure they are included. If the timing gets off, just run the report from your Me Card (or Saved Reports), then save it on your computer (as a webpage is fine) and attach it to an email.
You can follow the same process with any of the financial reports. For instance, you may have a Treasurer that wants to see the Contribution Detail report each week or receive an Excel / CSV file once a month. Just set it up for them and let the software work for you.


