
A friend of ours Damon Stoddard, a master black belt six sigma expert in Seattle, was volunteering to lead the groups ministry in his church about a decade ago when he called to ask me if I thought that TRUST would be a good way to measure the health of a small group.
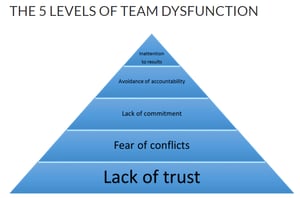
I was familiar with Patrick Lencioni's book on the Five Dysfunctions of A Team that identified Trust as the foundation upon which a team is built. But, had never heard anyone suggest applying trust to evaluating the health of small groups. I thought it was a brilliant idea and told him that I thought it would be a great measure for group health.
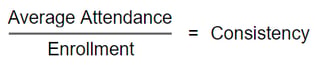
He then pointed out to me that one of the leading indicators of trust in relationships is consistency and asked if we could measure the consistency of a group. A few years earlier, we started calculating the average attendance per group whether they met once or five times that month1. So, all we needed was another column to divide that number by the enrollment in the group.
Think about this for a moment. If you are going to live out the "One Anothers" in your small group. If you are going to do "life together" with someone else. You are going to have to TRUST yourself to them. That's how discipleship works. Spiritual transformation is only going to happen if you trust those helping you achieve it.
Who are you going to trust? Friends that are consistently there for you. Faithful people who you are going to entrust your life message to (2 Timothy 2:2). Though just showing up isn't the full equation to measure trust, it is a very measurable indicator.
Damon's next question helped us sharpen the measure, "at what consistency rate would you say a group is healthy and unhealthy?" I had been leading small groups in churches for 18 years at that point and quickly responded. 2
80 to 100% Consistency = Healthy
Under 50% Consistency = Unhealthy
We sent him the data for his church. He did the analytics and discovered that 5/12 groups were above 80%, 4 were between 50 and 80%, and 3 were below 50%. So, he got his pastor and went to the 3 groups and discovered that all 3 of them had issues they needed help with.
Within a few months we created our Monthly Small Group Health report that we email to our clients who want it for their church. It's an Excel spreadsheet that adds a new sheet each month with a summary of group health within a ministry area.
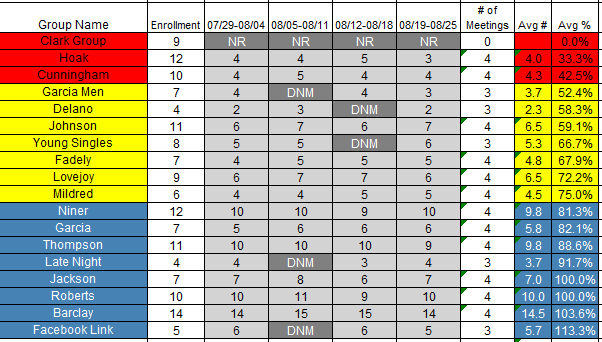
Groups are organized by consistency rate, not alphabetically. Blue zone groups average 80% and above. These people love their group. They even plan their vacation around group times. These are your leadership development groups.
Yellow zone groups are your average groups. Nothing outstanding generally, but also nothing to necessarily worry about. The Red zone groups are your focus groups for the next month. If the small group pastor / director and coaches don't do anything else this month, they need to know what's up with these groups.
Of course the output of the data is only as good as the input. But through trial and error with hundreds of churches we've developed a system to get 100% response from group leaders each week. It combines technology people are already committed to with a system of accountability appropriate to each leadership level. Join me for a Small Group Webinar to learn more.
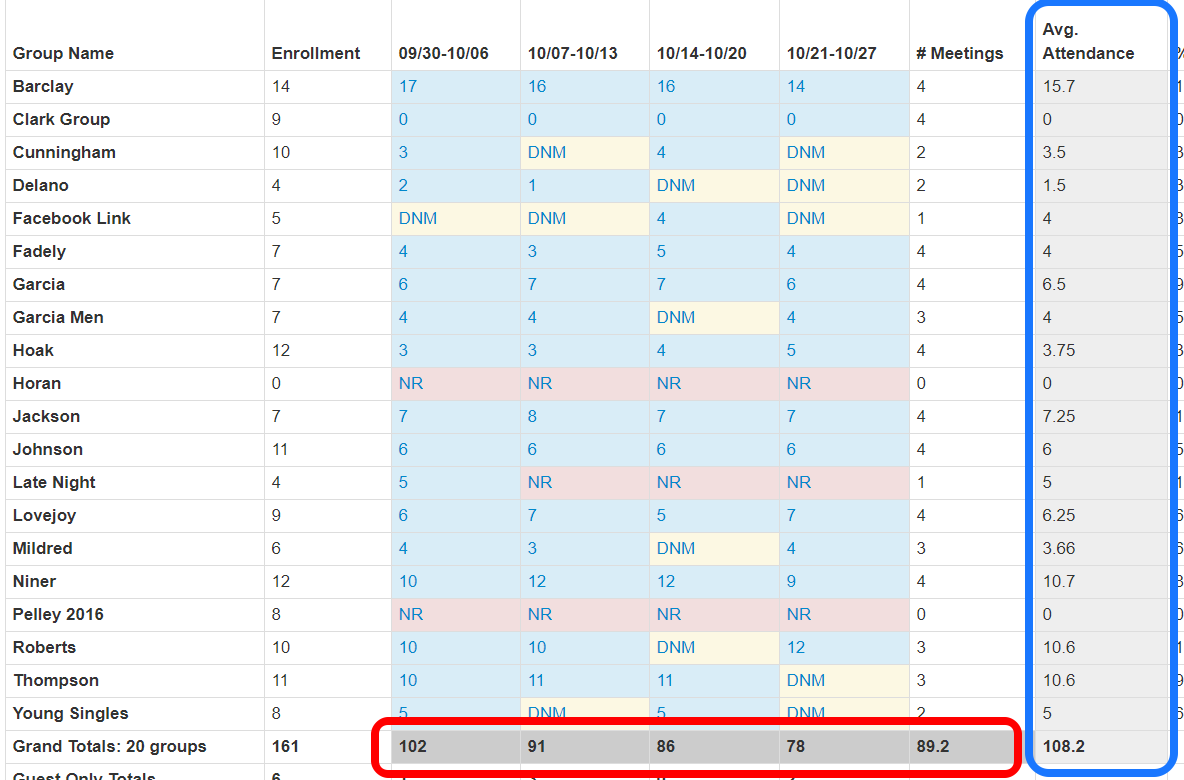
1 Small groups that meet in homes don't necessarily meet every week like traditional adult Sunday School classes do. This skews monthly attendance. To solve this we developed a metric that uses the sum of the average attendance (blue) instead of the average of the weekly summed attendance (red). This is a far better way to compare tradition Adult Sunday School numbers to small group numbers.
2 For larger groups that typically meet in classroom like Adult Sunday School we generally lower the percentage rate for health by 20 points. i.e. for "Small" Groups of 20 or more:
60 to 100% Consistency = Healthy
Under 30% Consistency = Unhealthy
So a typical Adult Sunday School of 30 is still considered in the Blue Zone with an average of 18 and in the Red Zone when it averages 9 or les.


