
 Last week we looked at our upgrade to the Group Summary report and talked about why consistency is helpful for identifying groups that need extra attention. This has huge value for the pastor in charge of that ministry.
Similarly, a summary of various ministries gives the Sr. Pastor, Executive, or Leadership team the ability to identify the make up and relative health of the various ministries that they oversee. They want to see the consistency of children's ministry compared to student ministry, or the consistency of adult small groups compared to worship. It helps them have a feel for where the wind is blowing and which ministries need attention.
In the past churches had to export this data and then manage it in something like Excel, but last week we added a feature that allows you to create a report to show a comparison of attendance for different ministries. It looks like this:
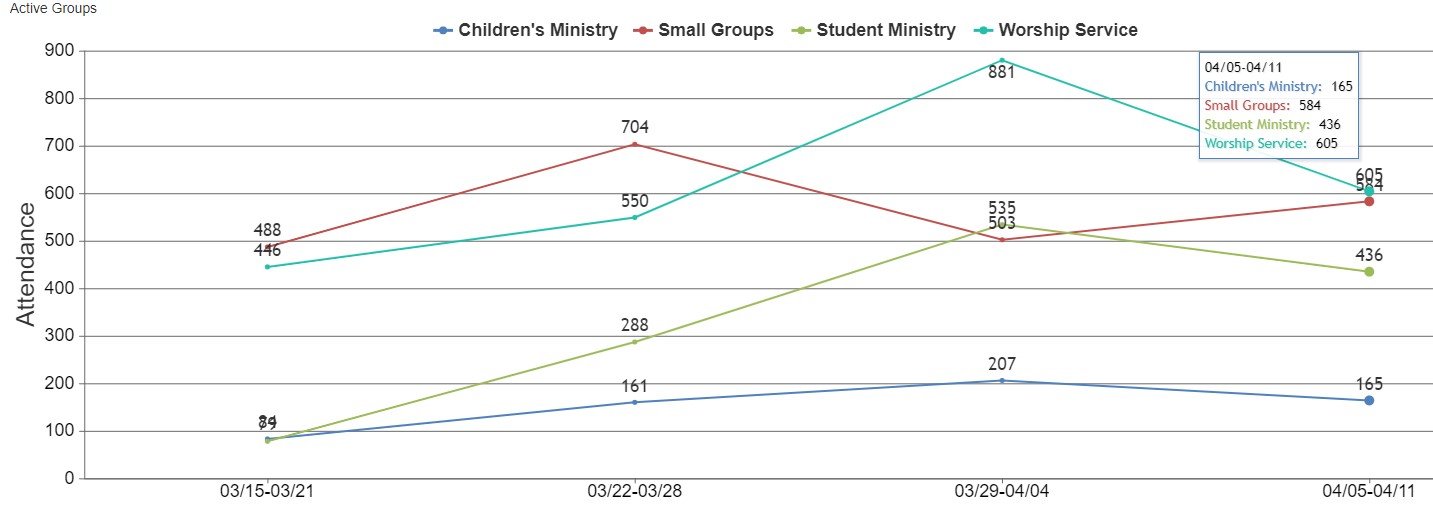
From the Legend you can see the line associated with each ministry. When you hover over a particular date a box shows up to summarize that date (ex. top right). Here's how to build this report.
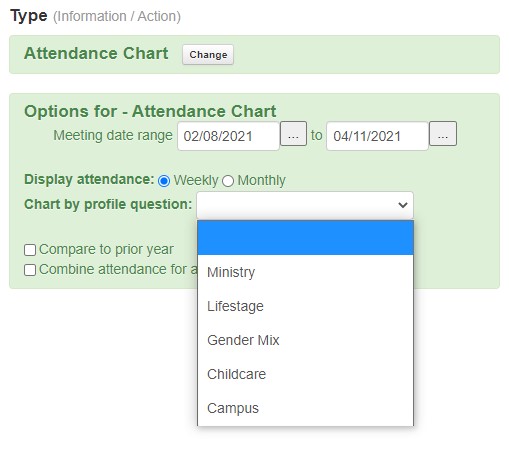
Report Type. Go to Reports > Groups > Attendance Chart. On this page you have the options to select:
- Your date range.
- Data by week or month. (Note: monthly is cumulative, not an average per week).
- The Group Profile question you want the chart to break on. Typically this is Ministry or Group Type.
- Note: once you select a profile question, the "Combine attendance for all groups" option disappears.
- The option to compare attendance to the same time frame last year.
Filters. Once you have selected your options in the green space, the filters become available to you. If you want, you can limit the report to fewer responses to the profile questions. For example: Children's Ministry, Student Ministry, Small Groups and Worship. This allows you to further target the data shown on the report.
Reports_Save_Me_Time. I had some time on the road last week listening to the book, Culture Code by Daniel Coyle. Among other things, it inspired me to think about a simple way to help CT users remember the most effective way to use reports in Churchteams. This is what I came up with. I hope it's helpful.
- Reports. Do these 3 things once you build a report you use a lot.
- Save the report by choosing the Save option.
- Me. Click the gear icon on the Me Card and choose this report so that it is readily available from the home page.
- Time. Take it up a notch and use Scheduled Reports to set a time for the report to run automatically and be emailed to whomever you want.
If you're not sure how to do each of these, give us a call. Our team would love to show you some more of the awesome things Churchteams can do for you.


