
 When I was on church staff, at the end of every month I would put together a small group summary for our leadership team to review. I would run the "Attendance by Group" report in Churchteams and paste the numbers into an Excel spreadsheet. Then I would copy and edit the formulas to complete the report. It took most of a day.
After a couple of years doing this every month and many conversations with other small group pastors, we automated this report so that it is delivered to your inbox every month. In developing it, we realized that every church needs feedback from their database for 3 different levels of leadership. All of these are included in this Monthly Small Group Report.
Executive Level
Your Executive teams needs feedback on the health of the ministries they oversee. Customize the report to break the report into different Ministry areas - Settings / Groups / KHI Reporting Option. When you do, you will get an 18 month summary chart for each ministry that looks like this.
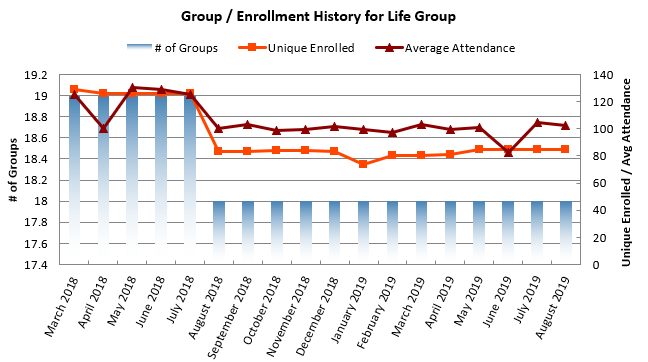
- 18 months allows you to see your recent trend in a ministry area including last year for the same month. The report adds a new sheet for each month so that you can go back to the beginning of using Churchteams.
- The bar graph shows you the number of groups based on the left y-axis.
- The line graph shows you attendance versus enrollment based on the righ y-axis.
A quick glance gives members of your Executive team a sense of how each ministry is doing and which ones need their attention.
Director Level
Your Small Group Director (Pastor) and Coaches need feedback on the health of the groups they oversee. Through some significanct conversations and experimentation over a couple of years we learned that consistency is the best way to objectively recognize the relative health of each small group.
Consistency is taking the average number present when a group meets (no matter how many times) and dividing it by the total enrolled in the group. The result is 3 zones or relative levels of group health.
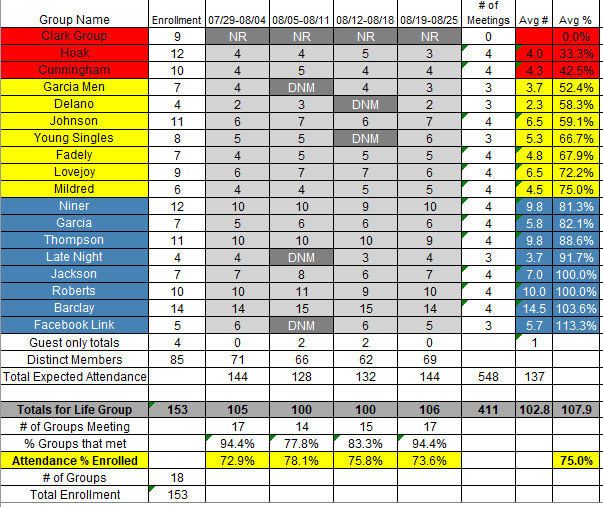
- Red groups have less than 50% show up when their group met on average. i.e. More people in the group don't show up than do.
- Yellow groups have 50 to 80% average attendance. These are fairly average groups.
- Blue groups have more than 80% average attendance when they meet. Excellent.
This report is revolutionary for small group ministries. It enables the small group director and coaches to zero in on the groups that need their attention. If they don't do anything else that month, they need to see what's up with the Red zone groups. Blue zone groups are their leadership development environments.
This is such a big deal, we'll give the next blog post to the significance of the idea of consistency of a group. But here you can see how Red / Yellow / Blue has the same significance for Small Group Directors as the 18 month trend does for the Executive Team.
Leader Level
This is where the rubber hits the road. Now we are talking about the lives of individual people. The 18 month trend line is not really a metric leaders are interested in. It affects their ministry very little. But, everyone is interested in what's going on in the lives of individuals. Click in the Group Name cell on the Monthly Group Report for any group and you'll find a hyper-link that has you login and then creates for you a previous month summary chart for the people in that group.
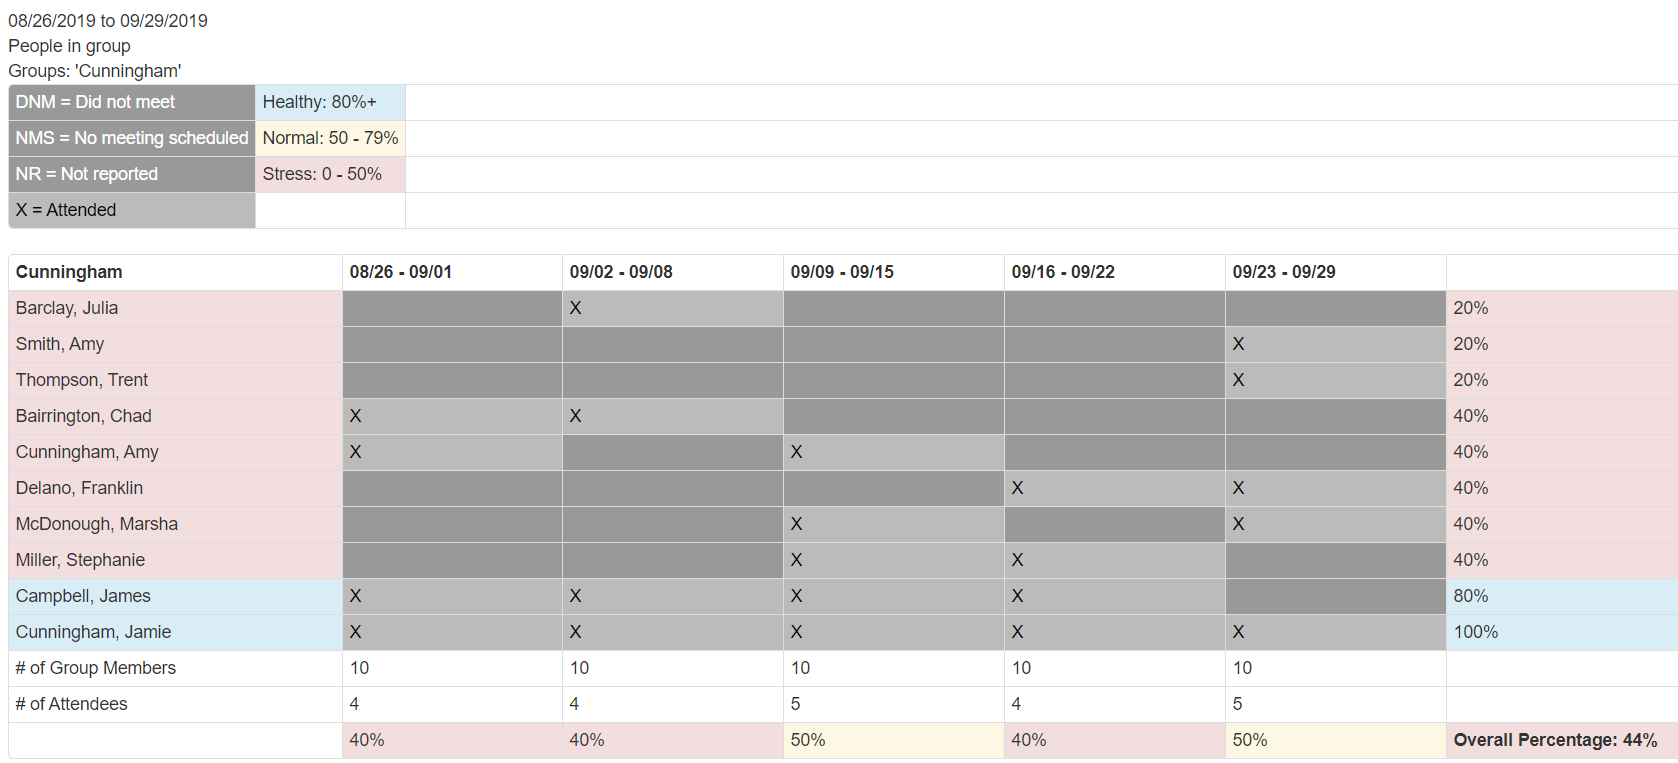
- The report is sorted based on consistency rate from least to most, not alphabetical.
- The Red / Yellow / Blue highlights are used for both person and meeting consistency.
- Directors / Coaches develop questions about specific people from this report.
Without specific data, it is hard to pinpoint where specific problems might be within a group. But, good data can confirm a hunch or uncover other issues that might be affecting the group. At very least they can point to specific conversations that need to be engaged to discover what is really going on with the group.
All three levels are shepherding levels. But the span of care required at each level is different, so the metrics needed are different. All three levels are vital to the overall health of a small group ministry.
Using data to inform decision-making is vital for effective ministry. Remember the shepherd in Luke 15? He had to have a system in place to determine if one of his sheep was missing. So, he simply counted. If he failed to do this, he would not have known what the needs were in his flock and where to focus his attention.


